It has been a wild stretch of weather, a true case of March Weather Madness unfolding across the United States and even globally. The atmosphere is putting on a show that feels almost surreal for this time of year. Records are not just being challenged — they are being shattered in multiple regions at once, and the contrast from one location to another is striking.
So what is driving this pattern? Is this another signal of climate change, or are we witnessing the natural evolution of a powerful atmospheric cycle?
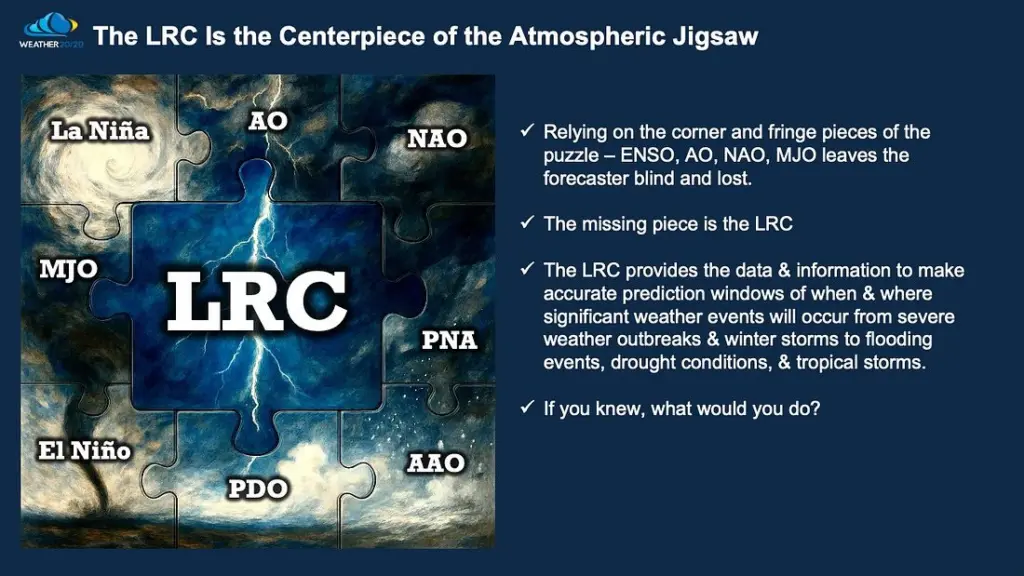
This is the atmosphere doing what it has always done — organizing itself into a repeating pattern. This is the Lezak Recurring Cycle (LRC) in action. The same pattern that began taking shape last October is now cycling back through, bringing with it the same core structure — just expressed differently as we move from winter into spring.
While the LRC is the centerpiece of the atmospheric jigsaw puzzle, there are still other influences that matter. We factor those in as well, weighting them into our forecasting process. That combination — the LRC as the foundation, with these additional signals layered in — is what has helped us achieve some of the most accurate forecasts in the medium to longer ranges, extending weeks to even months in advance.
One of those key influencers is the Arctic Oscillation (AO). This is something we always monitor closely because when it makes big moves, the atmosphere responds.
Look at what has been happening since the beginning of March — a sharp rise into strongly positive territory. That shift has helped open the door for the record-breaking warmth we are now experiencing across much of the country.
 |
Another big influence driving the weather pattern is the El Niño–Southern Oscillation (ENSO). This is a longer-term signal that we always factor in, especially when we’re looking ahead beyond just the current cycle.
Right now, ENSO is in the middle of a phase change. It is trending toward a neutral state, but there are increasing signals that El Niño may redevelop as we head into next winter. That will become more and more important as we move through the summer and begin watching the formation of the next LRC pattern this fall.
As always, the key is understanding how these pieces fit together. The LRC provides the structure — the blueprint of the atmosphere — while ENSO helps influence how that pattern expresses itself over time.
helps influence how that pattern expresses itself over time.
 |
An example of this year’s LRC in action:
75 days before the recent severe weather outbreaks, Weather 20/20 identified and predicted the risk window for March 8–17. This was not a short-term model picking up on something a few days out — this was the pattern itself, the DNA of the atmosphere, cycling forward and signaling what was coming more than two months in advance.
Now, take a look at the following four slides. You will see how the severe weather events unfolded right over the areas we highlighted, lining up with the timing we identified. This is where the LRC separates itself — not just recognizing patterns, but projecting them forward with actionable precision.
This is the power of understanding the pattern.
 |
 |
 |
 |
 |
This segment of the LRC will return again, cycling back through in late May into early June. It is not just a one-time event that came and went. The pattern is still alive, still repeating, and this part of it is one we have been watching closely.
In fact, many of you have already had this forecast in your Weather 20/20 Severe Weather Guide for weeks now. It has been there, laid out in advance, because that is what this pattern has been telling us.
So now, mark it down: May 22 to June 3. That is the next window when this segment of the pattern is forecast to cycle back through and once again raise the risk for severe weather.
 |