The atmosphere just delivered some truly unusual winter weather in places that rarely experience it. The Arctic Oscillation plunged deep into negative territory—and for those who have been following this pattern closely, that outcome was not a surprise. I’ve been consistently talking about this risk all season, well before the headlines caught up, because it was embedded in this year’s recurring pattern.
Below is a summary of the major winter weather impacts from the past week, all tied to the deep negative AO interacting with this year’s LRC pattern—and an important setup for what comes next.
1) Carolinas & Southeast Under Historic Snow
- All 100 counties in North Carolina saw accumulating snow — from beaches to mountains — with up to ~18+” in some areas.
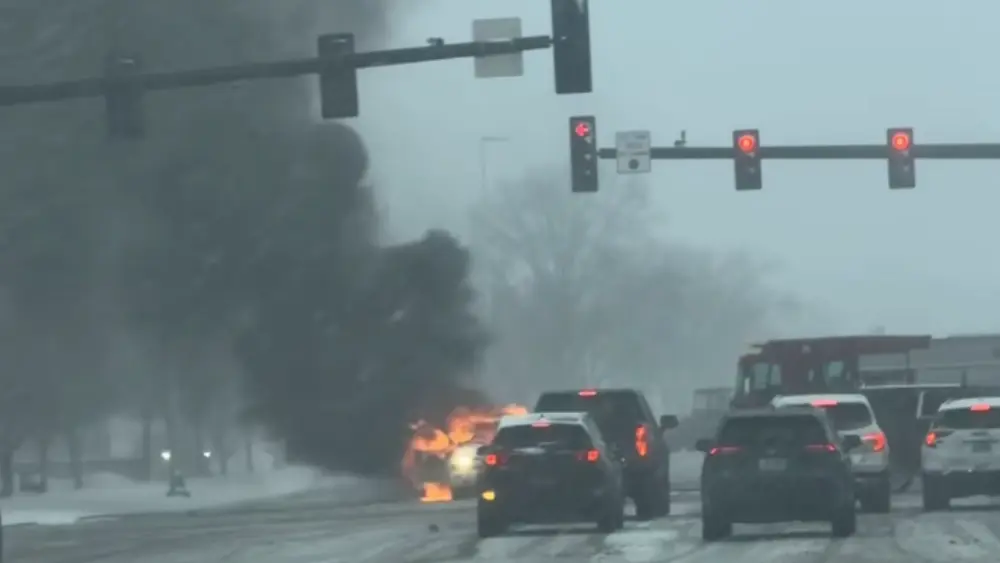
- States of Emergency declared, hazardous travel conditions persisted, and infrastructure was damaged.
- Even rare snow in Florida was reported along with strong winds and coastal flooding along the East Coast.
2) Snow, Ice & Blizzard Conditions Widespread
- Heavy snow and near-blizzard conditions were confirmed from Georgia through Virginia and into the Northeast with strong winds and dangerous travel.
- Snow flurries fell as far south as northern FL outside the normal winter footprint
3) Southern U.S. Ice Storm / Mississippi Impacts
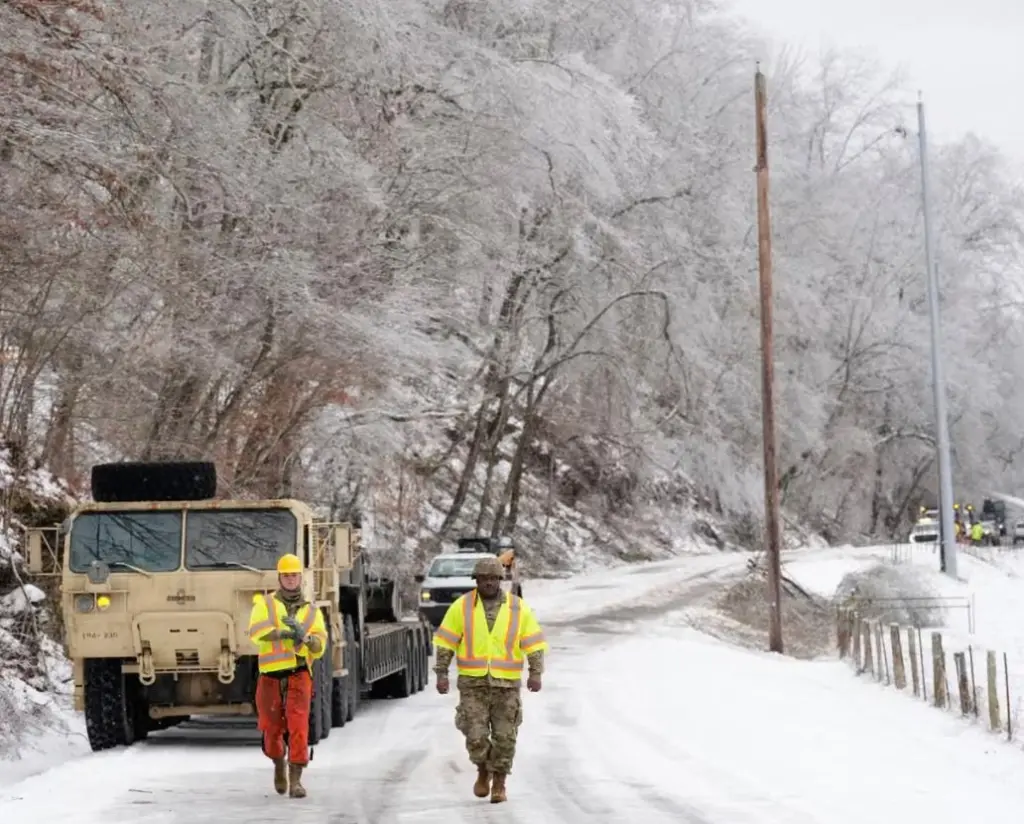
- A devastating ice storm hit Mississippi and parts of the Deep South earlier in the week, with >150,000 without power, downed trees/lines, and impassable roads.
- Recovery challenges continued under deep cold.
There have been 85 deaths associated with this storm system. What caused this weather disaster?
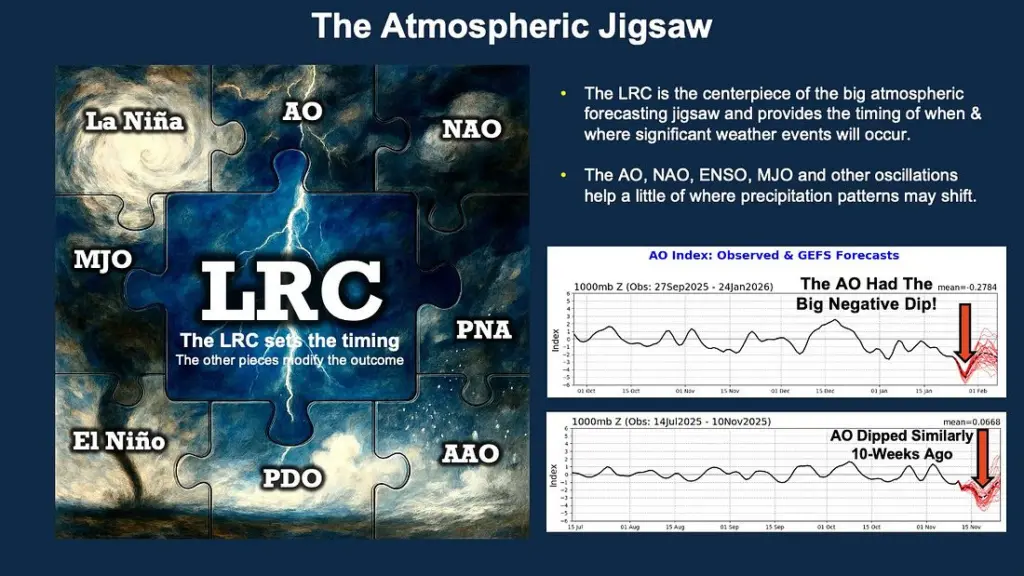
The conditions that led to this series of powerful eastern storm systems came together when several key atmospheric pieces locked into place. At the center of that puzzle is the Lezak Recurring Cycle (LRC).
This year’s LRC is cycling in the 10–11 week range, and the timing of this latest storm was right on schedule. Timing alone, however, does not determine impact. The difference—and the reason this storm became stronger and tracked farther south—was the behavior of the Arctic Oscillation (AO).
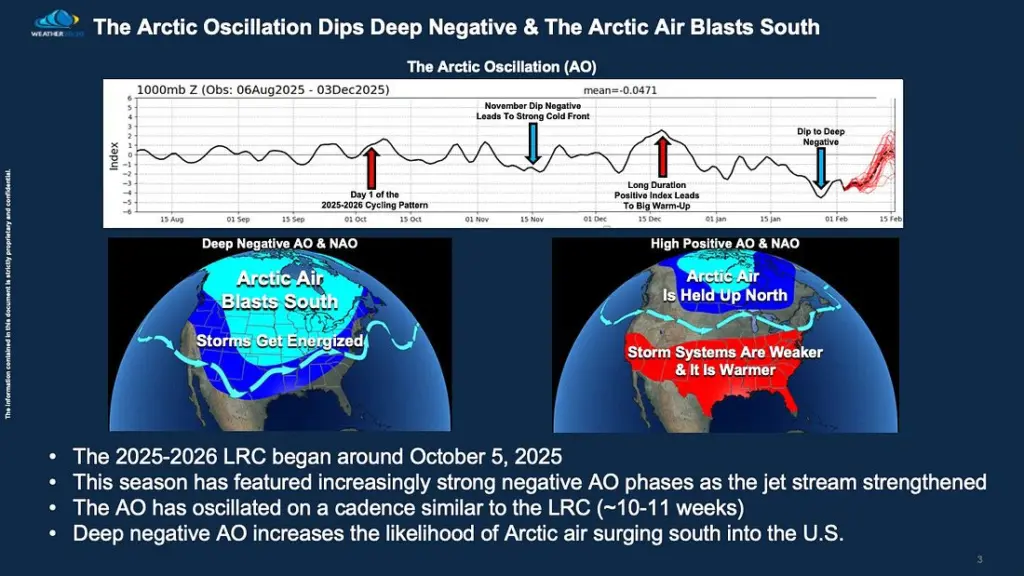
As the AO dipped deep into negative territory, cold Arctic air was able to push much farther south than normal. That set the stage for a major storm impacting a large portion of the country, with Kansas City on the northwest edge of a sprawling, high-impact system a couple weeks ago. Shortly afterward, a follow-up storm intensified near the Carolina coastline, producing the widespread winter impacts millions experienced over the past week.
What’s especially important here is that the AO itself is not random. As shown below, when the AO dips negative, the atmosphere becomes primed for larger, stronger, and more disruptive storms. Looking closely, you can also see that the AO appears to be cycling as well, aligning closely with this year’s 10–11 week LRC pattern.
This is how the puzzle comes together—not one factor in isolation, but multiple atmospheric pieces working in sync, with the LRC providing the timing framework that allows these high-impact events to be anticipated in advance. It is really complex, obviously, and the forecast was difficult. At the end of the storm the impacts were widespread and are going to be etched in the memories of millions.
One of the core principles of the LRC is the presence of anchor ridges and anchor troughs. These features act as the semi-permanent framework of each year’s atmospheric pattern and help explain where storms prefer to develop—and where they tend to struggle.
- Storm systems will be more frequent and likely stronger near the anchor troughs
- Storm systems are more likely to be less frequent and weaker near the anchor ridges.
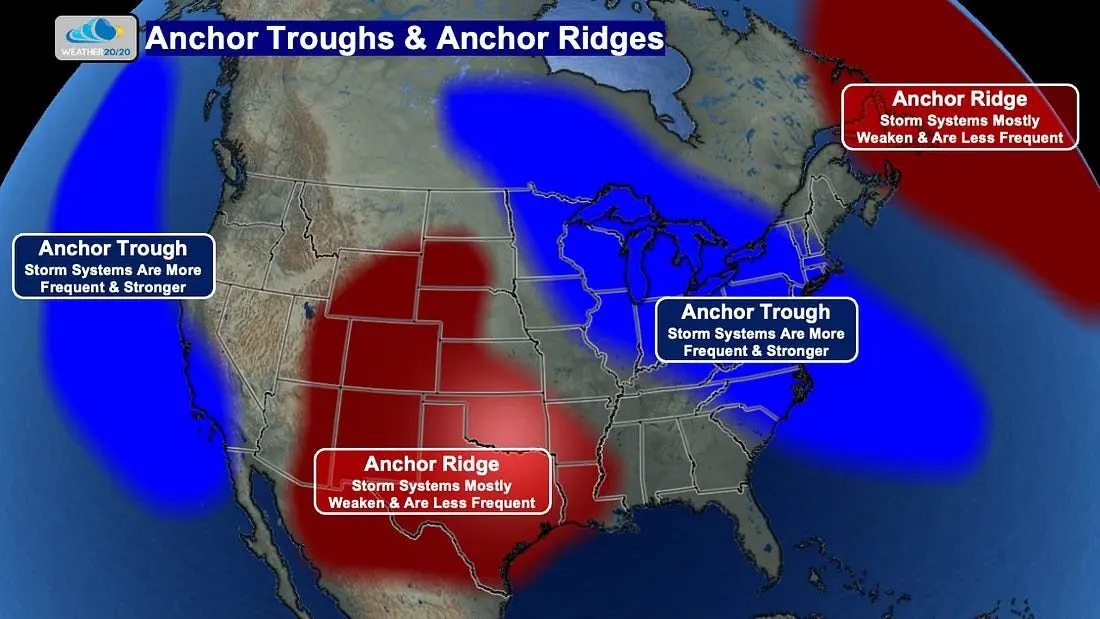
One of this year’s anchor troughs extends from northwest of the Great Lakes southeastward to just off the Carolina coast—and that is exactly where the most recent storm exploded in energy just a few days ago.
The anchor ridge, on the other hand, has been producing extreme impacts of a very different kind.
Salt Lake City has recorded just 0.1 inches of snow this winter. Let that sink in. Savannah, Georgia has received more snow this season than Salt Lake City. That alone tells you how dominant this ridge has been.
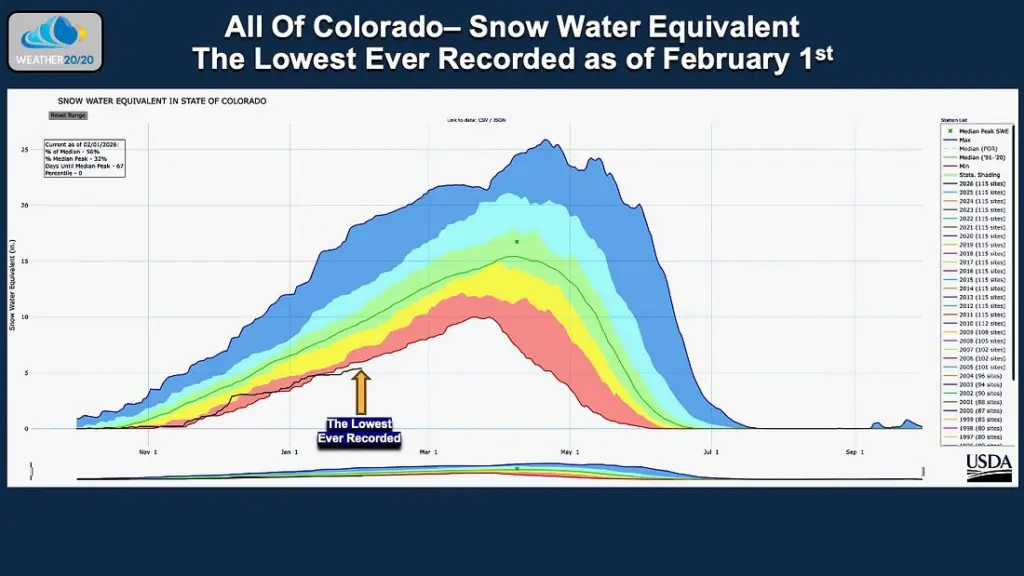
Now look at the Colorado Basin below. When we average snowfall across the entire state of Colorado, this year’s snow water equivalent—highlighted by the arrow on the chart—is sitting below the lowest year ever recorded, shown by the bottom line near the red shading. This isn’t just below average. It’s well below the previous record low.
This developing snow drought is very bad news—both for the upcoming fire season and for long-term water supply concerns, especially for the Colorado River Basin as it feeds downstream toward Arizona and the Southwest.
This is another example of how anchor ridges and anchor troughs don’t just shape individual storms—they define entire seasons.
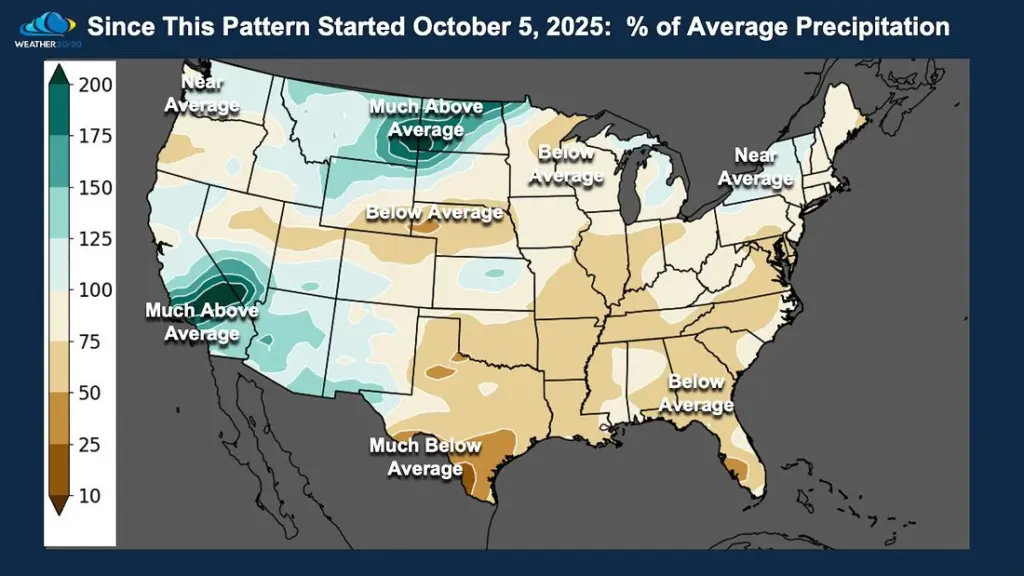
The next two charts show temperature departure from average, along with percent of average precipitation, calculated from the point when this year’s cycling pattern became established—around the end of the first week of October.
These graphics help put the impacts of this year’s pattern into context, showing the cumulative effects the LRC has had on temperature and precipitation across the region over time.
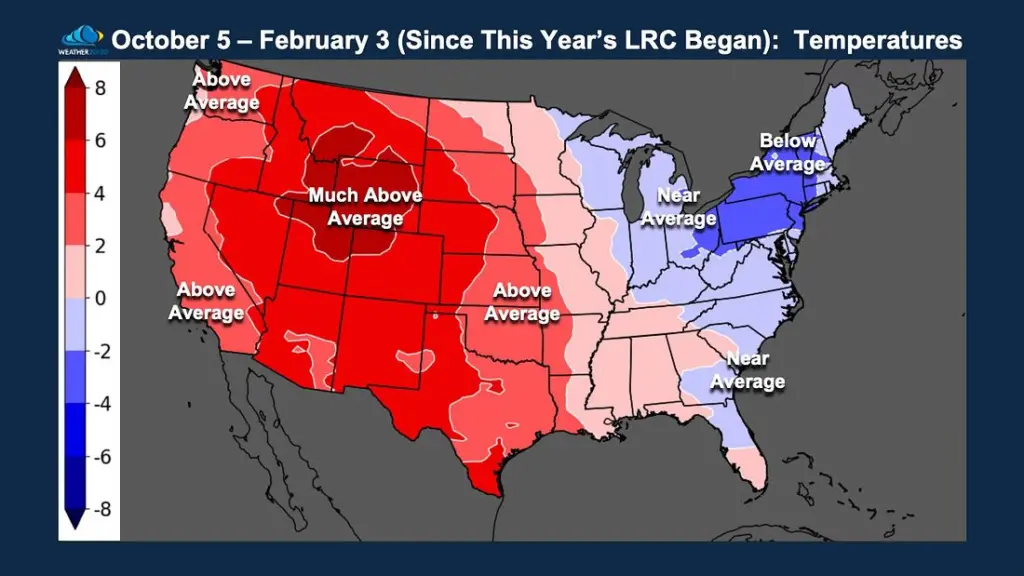
Even with the cold outbreaks, the region west of the Mississippi River has had a mild winter while the northeast has had a harsh one. Our area has experienced temps pretty close to normal with below normal snowfall for the season thus far.
Now, let’s take a look into what the rest of the winter may hold. January was pretty tame across the area with less than 6″ of snow for the WHOLE MONTH!!! The LRC can predict months in advance.
These forecast risk windows, issued weeks to months in advance, have verified at nearly 90% accuracy over the past few years. In this case, the segment of the weather pattern that produced five storm systems across the U.S. from November into early December is now cycling back through over the next three weeks.
The Developing & Cycling Weather Pattern Now
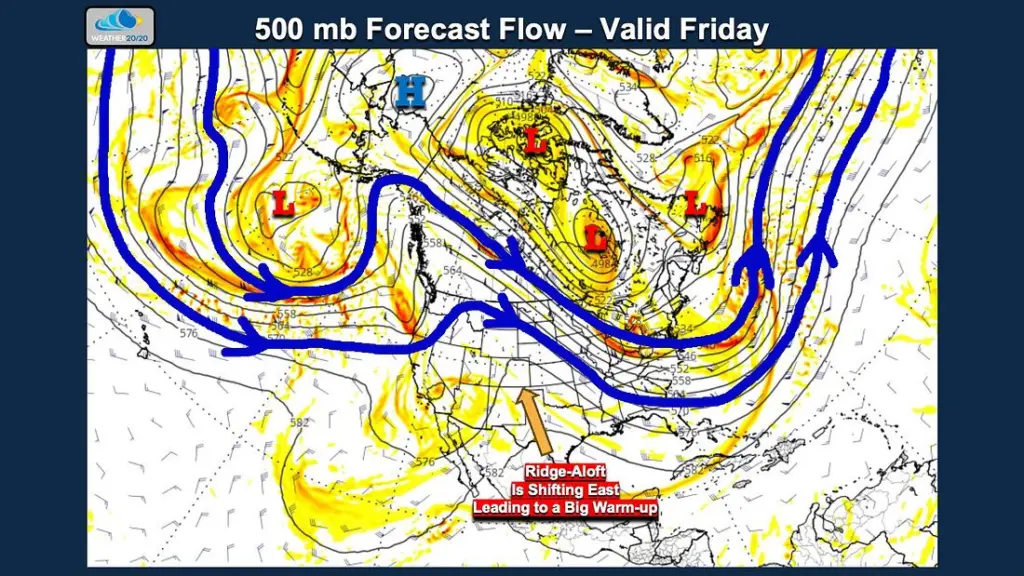
THIS ^ has been a pretty dominant pattern this winter with a persistent northwest flow into the N. Plains. However, we have had “stormy” stretches of the LRC and we are about to enter a “stormier” part of the LRC cycle as storm systems begin to line up for next week, a clear signal that the pattern is once again organizing—right on schedule within this year’s cycle:
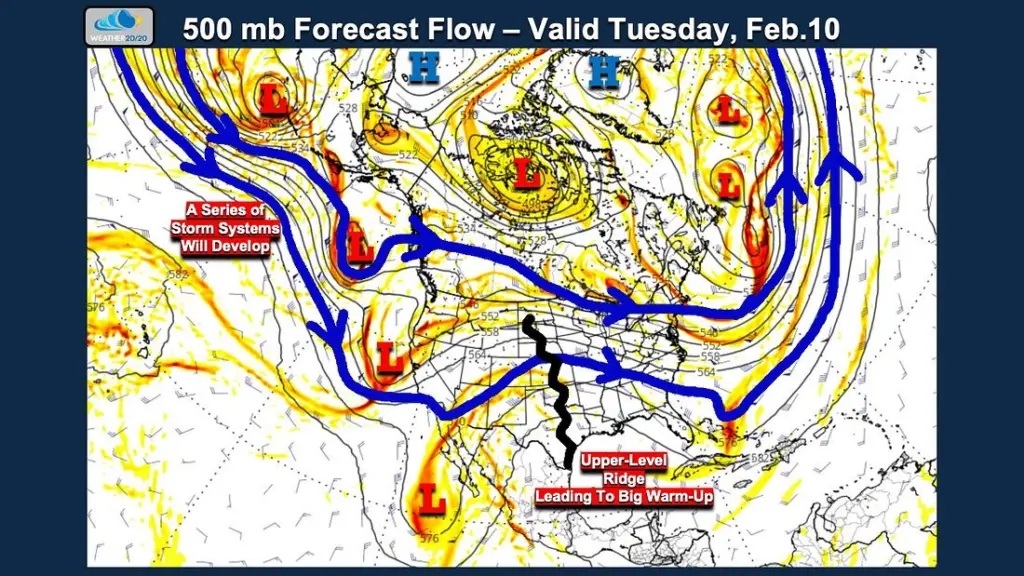
A few of the storms associated with this part of the pattern became quite strong, so the key question now is how the models trend as this cycle returns.
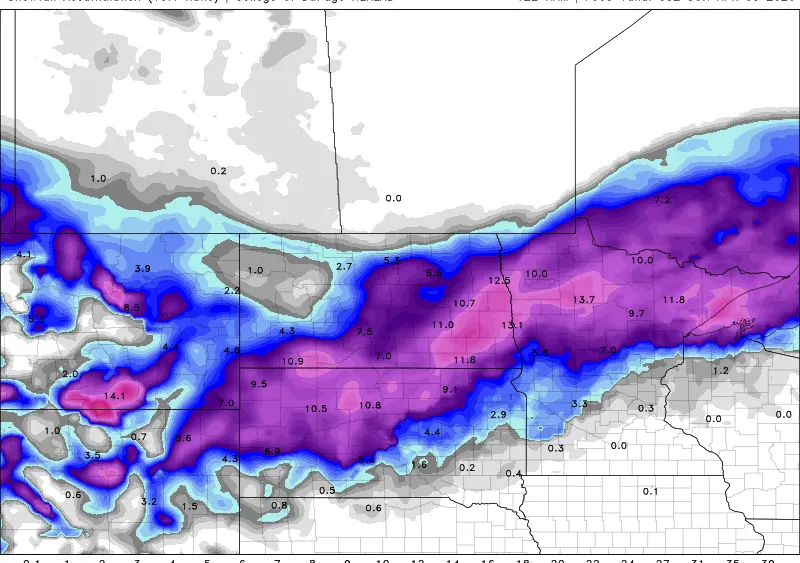
Here’s a look at a few models predictions for snowfall over the next 2 weeks:
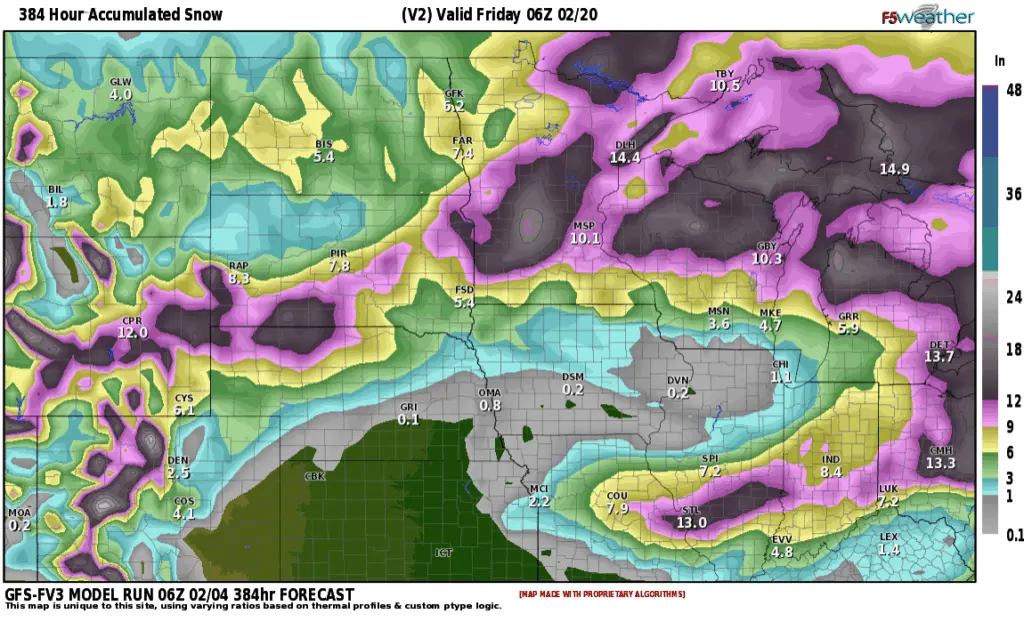
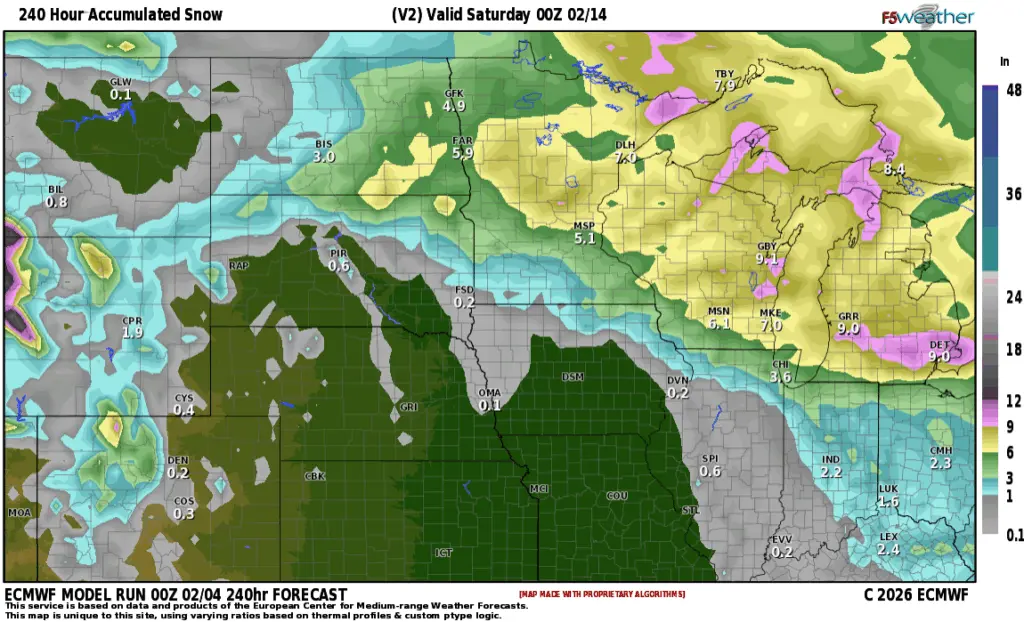
There will be a couple of “Colorado lows” that affect the area with snow. The BIG question is where will the heaviest snow fall? Those details will become more clear within the next week but rest assured that the weather WILL become more active next week through the end of the month. If you are interested in learning more OR subscribing to the LRC for your business/pleasure, email Gary at gary@weather2020.com
Stay tuned……